[download report in PDF format]
‘At the beginning of 2005, I wrote a piece entitled “The Mother of all Crossroads”. Through the year I delivered numerous presentations using the same title. In essence my view was that the center of economic gravity would shift inexorably from the West to the East. I similarly used the phrase “Short the West and Long the East”, as a way of capturing the “tectonic” shift in the global economy. This was never meant to be a one year view. As you know, it is my belief that this is a multi-decade perspective. Through the year, I continued my positive view on oil prices and developed a very positive view on Japan. I also spoke of the “imbalances” in the US and as the year advanced, highlighted the unsustainable level of US house prices.
It is now time to discuss the key themes that are likely to shape and define the economic and financial landscape in 2006 and beyond. First, let us allow the statistics to speak for themselves. 2005 could be seen as the year of “Anywhere but America”. When was the last time you saw numbers like these below?
| World Stock Markets in 2005 (%)* | |
| * All markets shown in local currency terms | |
| DOW | -0.61 |
| S+P 500 | +3.0 |
| NASDAQ | +1.37 |
| JAPAN (TOPIX) | +43.50 |
| KOREA (KOSPI) | +53.96 |
| INDIA (SENSEX) | +42.33 |
| BRAZIL | +27.71 |
| FRANCE | +23.40 |
| GERMANY | +27.07 |
| RUSSIA | +83.29 |
| EGYPT | +146.13 |
| DUBAI | +131.27 |
| ASX 200 | +17.60 |
Japan outperformed the US by 40%! This begs the obvious question. Will it happen again in 2006? Before we attempt to answer this question, we need to take a trip around the world. Our first destination is the “Mother of all Economies”, the United States of America.
USA
The American economy performed more strongly than I had anticipated and whilst the fourth quarter GDP stats are not available until the end of January, it looks like the economy grew about 3.4% in 2005. Impressive, given all the headwinds it faced. Higher energy prices, higher short-term rates, Katrina, Rita, etc. The nation of “shop ‘til you drop”, kept shopping. The imbalances grew ever larger and the word unsustainable was used by anyone who had even a rudimentary understanding of economics. I exclude the “its different this time” cheerleaders on Wall Street. However, let’s give America some credit for their impressive performance (no pun intended). For those of us who had been highlighting the relationship between housing and the economy, namely the home equity extraction factor, it was pleasing to see the Federal Reserve publish a paper, authored by Alan Greenspan and James Kennedy, which showed that between 2001 and 2004 US households had extracted US$1.7 trillion from their homes. Most Analysts, the Fed included, estimate that approximately 50% of this amount has been spent on so called discretionary items. The remainder was used to pay down credit cards, more expensive loans, invest in financial assets, etc. This means American households used their homes as bank ATMs, liquefying their bricks and mortar to sustain their spending. As we know from experience, Australia and the UK provide us with useful clues in this instance, this only goes on as long as house prices rise.
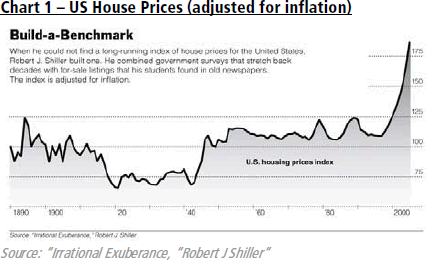
Chart 1, was produced by Robert Shiller, Professor of Economics at Yale University. Shiller wrote “Irrational Exuberance” which was published in early 2000.
The chart hopefully speaks for itself and requires little explanation. There is absolutely no doubt that the housing market has been the“locomotive” driving the US economy. A study by Merrill Lynch estimates that 50% of all private sector jobs between 2001 and mid 2005 were housing related (real estate agents, mortgage brokers, bankers, building sector, etc.). Similarly, over the same period, half of all economic growth was a function of the housing market. These are staggering statistics. I am ever mindful, having spent 22 years in this industry, of that wonderful quote, “Statistics, if tortured sufficiently, will confess to anything.”
So, notwithstanding, the above caveat, you have to believe that if house prices weaken or even stop rising then home equity withdrawals will decline, which in turn will generate a sizeable“negative multiplier” effect and hence the economy will weaken.
Household consumption now comprises a record 71% of GDP and hence any weakening in spending will have a proportionally significant effect. We could make a reasonable argument for an increase in business investment as companies have record amounts of cash and this sector will provide some offset to the anticipated weakening in consumer spending. It is important, however, to remember that business investment accounts for only a fraction of the economy when compared to consumer spending. The evidence of a weakening in the housing market is now overwhelming and it appears it peaked at the end of the second quarter last year. The debate is no longer about whether it has peaked, but about how much it will weaken.
It is also worth noting that the three “bubble” regions, California, Florida and the North East are likely to see significant price declines. Those areas constitute a significant proportion of the US economy. The consensus view is that the housing market will be essentially flat, i.e. experience a soft landing. For those of you who subscribe to this view, look again at Robert Shiller’s chart. Once you have done that then consider the following statistics. In early 2005, over 30% of new mortgages were option ARMs (adjustable rate mortgages). These are better known as negative amortisation mortgages and allow the borrower to make monthly payments that are less than the interest cost in the first few years and hence increase the principal repayments in the later years. In early 2005, there were reports of day trading in apartments in Florida. Housing affordability for the first time buyer has plunged over the last year to its lowest since inception of the series in 1986. Residential investment as a share of GDP is at the highest level in 50 years.
Applications for loans to purchase real estate are down 12% from the record set in June. Investment buying accounted for almost a quarter of US home transactions in 2004. The CEO of Countrywide Financial Corp (America’s largest independent mortgage lender) said in October, “I have been doing this for 53 years and it seems we are topping out.” I think I have made my point about the US housing market and we should move now to the outlook for short term US interest rates.
Alan Greenspan retires on 31 January, having been Chairman since August 1987. His successor, Ben Bernanke, will chair his first FOMC meeting on 28 March. The Federal Funds rate is currently at 4.25% and will rise to 4.50% on 31 January. The real debate is now about what Bernanke will do at his first FOMC meeting. Will he raise rates to demonstrate his inflation fighting credentials? An examination of the Fed Funds futures suggests that the market is no longer convinced about a rate hike at the 28 March meeting as the implied rate for the April Fed funds futures is currently at 4.63%. Much has been said about Bernanke’s fondness for econometric models etc and similarly his well-known belief in a formal inflation target. This in a way makes his actions more predictable. For the record, I believe he will raise rates to 4.75% at the 28 March meeting. He then could be known as “one time Ben”, for rather a long time as I believe 4.75% will be the peak in rates in 2006.
Ultimately, it is all about the housing market. If you believe house prices will continue to rise in 2006 then rates could rise to 5.25%, perhaps even 5.50%. If you believe, as I do, house prices will fall then 4.75% will be the peak. Before we leave the interest rate outlook, we must comment on Greenspan’s “conundrum”. As I said through 2005, the real conundrum to me was why Greenspan thought it was a conundrum! The yield curve finally became inverted in the last few days of 2005. All of you know the story by now. Every recession in the last 30 years has been preceded by an inversion of the yield curve. Wall Street and, alas, Greenspan, have declared that yield curves do not matter anymore. They say there is a surplus of world savings and the Chinese, Japanese and the Arabs have bought all their Treasury bonds. The yield curve, according to Wall Street, has lost its predictive qualities and should be discarded into the dustbin of financial history with anything that spoils their argument at any given time. Price earnings multiples were only recently retrieved from the dustbin, having been sent there in late 1999. The US yield curve suggests to me that America has borrowed growth from its future. It suggests to me that growth is likely to be weaker in the years ahead. It similarly illuminates the markets belief that inflation is largely under control.
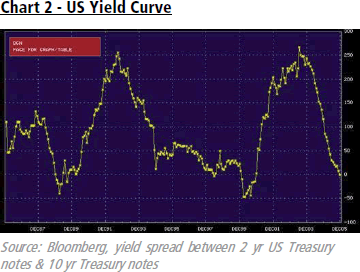
At the time of writing, the yield curve is very marginally positive (2 b.p), but with the prospect of two more interest rate increases, we are likely to see an inversion of 25 b.p. to 35 b.p. At this point the Fed starts to pay attention and stops tightening and similarly by then the housing market slowdown will be front-page news.
Time to talk about US equities. 2005 saw the smallest annual move in the Dow since 1896. Similarly, the Nasdaq recorded its smallest move since the index started trading in 1971. Corporate profits have had another good year hence we have seen P/E multiple compression. Also it is worth noting, as we did at the outset, that America massively under performed every other market. Japan outperformed by an astonishing 40%. Time for some predictions. US stocks could perform quite well this year. Everyone and their Labrador in the “relative return world” (closet index managers) has jumped on the underweight US stocks bandwagon. Everyone has been long emerging markets, long Asia, etc. We could, therefore, see a re-balancing by the relative return brigade as they move back towards their benchmarks. Similarly, in a largely three asset class world of bonds, equities and real estate, one has to concede that real estate is very expensive as are bonds and hence, in a relative valuation world, US stocks are relatively cheap. On an absolute basis, they are not a screaming buy, however, due to the strength in earnings and the pitiful rise in prices, price earnings multiples are arguably close to fair value. On an earnings yield to bond yield basis, they are clearly very cheap. I do not want to get into a long academic debate about the efficacy of the EY/BY relationship. The fact is most fund managers use it as a valuation tool in their asset allocation process. The other forecast I am willing to make is that technology stocks could perform particularly well in the first half of the year.
I have a feeling much of the above is a story for the first part of the year. There is a saying in the market, “Don’t fight the Fed”. This was clearly the case in the US stock market in 2005 and brings me to another reason why US stocks will perform better this year. The market battled a significant monetary headwind last year and since I believe we are very close to the end of monetary tightening the market will clearly rally in anticipation of such an event. In my conclusion I shall make some comments about the massive“imbalances” in the US.
EUROPE
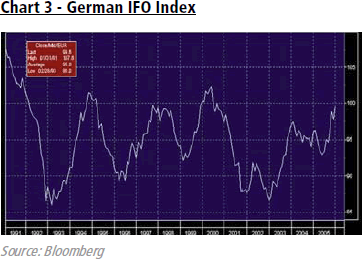
For most of 2005, I did not have many positive opinions on the European economy, although we did highlight the attractive relative valuation argument in favour of stocks versus bonds. I am pleased to report that we have, in the past few months, seen an undeniable improvement in the European economy, I exclude the UK. Britain, unfortunately, continues to suffer from its post housing bubble hangover and has seen a significant weakening in household consumption. Perhaps there is a message here for the US. I have included a couple of charts, which help illuminate the improved prospects for continental Europe.
The German IFO index, which measures business confidence, suggests the German economy will improve through 2006.
The Belgium National Bank Confidence Index is one of my favourites as a leading economic indicator for Europe.
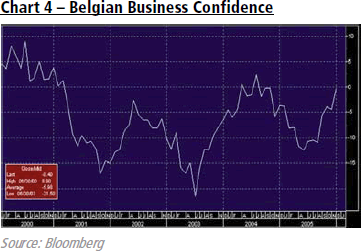
Nearly 70% of Belgium’s exports go to Europe and hence this index is a valuable barometer of European economic conditions. In recent months it has clearly signaled better times ahead. The ECB actually changed rates for the first time in years, by raising them to 2.25% from 2.0%. But, let us not get too excited. German growth is likely to be about 1.5% to 2.0% in 2006 after about 1.1% in 2005. Italy will struggle to produce a positive rate of growth in 2005 and could see growth of about 1.5% in 2006. The French will continue to ‘muddle’ along at about 1.5%. The real story in Europe is not economic growth; it is more about corporate profits and the equity outlook. German equity valuations are relatively cheap when compared to bond yields. The forward P/E on the Dax (estimated earnings look very achievable) is currently at 14.50; hence the earnings yield is 6.9%. Ten-year bond yields are at 3.25%. On a EY/BY basis German stocks look cheap. We acknowledge that the ECB will probably raise rates to levels near 2.75% by year end, but this will not pose too much of a hurdle to the market. In the UK, the housing market remains weak, which will in turn keep the Bank of England on hold for the foreseeable future. I cannot envisage the UK being a dynamo of growth in 2006. Once again, however, equities are reasonably cheap versus bonds.
THE MIDDLE EAST
Iran is likely to be a focal point for financial markets in 2006. Whilst events in Iraq will continue to horrify us, the markets have become almost “desensitized” to the news of bombings and carnage. This in itself is very sad, but unfortunately it is the harsh reality of the financial markets. Iran, however, has the potential to generate market-moving news. In particular, it’s President Mahmoud Ahmadinejad. The most powerful weapon he has at his immediate disposal (assuming the nuclear version is five to ten years away) is that of oil. We should not dismiss the possibility of Ahmadinejad deploying the oil embargo threat as a geopolitical tool with which to influence events in the region. This is a man who will leave his mark on history.
CHINA
Nothing about China surprises me anymore. The news, however, in December that the economy was nearly 20%, or US$285 billion bigger than we had been led to believe, was even for China, pretty amazing. This was sufficient to ‘leapfrog’ them up the world economic rankings to number four. On a PPP basis (purchasing power parity) they would be ranked number two. All in all, this was good news as the revision was primarily in the services sector and served to allay fears that China was too heavily reliant on fixed asset investment for its growth. The services industry following the revision, accounted for 40.7% of GDP, up from 31.9% previously.
In a recent article in the Financial Times, by Martin Wolf, entitled“The World begins to feel the dragon’s breath on its back”, Wolf says the following, “The world economy is undergoing a revolution, as a China led Asia returns to its historic role at the center of affairs. With an aggregate population of more than 3.3 billion, the developing countries of east and south Asia contain more than three times as many people as today’s high income countries… What does economics suggest might be the consequences of the entry of these huge supplies of cheap and hard working labour on the world economy? The answers include: a worldwide decline in the relative price of labour-intensive goods and services; a rise in the relative price of commodities, especially where their demand is most affected by industrialization; a decline in the price of unskilled labour against that of capital, both physical and human and an increase in global competition”.
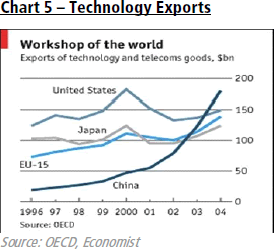
The process of urbanization, industrialization and motorisation of the world’s most populous nation will have seismic and profound implications for all of us for many decades to come. Over the last several years there was a perception that China was an emerging economic giant. In 2005 it became a fact. To date there has been much analysis and comment on China becoming the workshop of the world and with a workforce of 750 million, which exceeds the workforce of the entire advanced economic world, clearly the Made in China label will be with us for a long time (see chart 5).
But, perhaps, we are soon to enter a period where the phrase “Consumed by Asia” will become just as appropriate. We shall return to this theme in our conclusion. The following statistics from a study entitled “The Rise of the Chinese Consumer” are particularly interesting. This study predicts that the numbers of urban households earning more than US$5,000 a year will increase annually by 24%. Accordingly, the percentage of urban households with incomes of more than US$5,000 will rise from 17.4% now to just over 90% in 2014.
The US$5,000 household income level is seen as important for analysts of consumer spending, since studies show that income above this level enables households to spend on discretionary items rather than purchasing only necessities. I continue to believe that the emergence of China is a major positive for the global economy. China and Asia in general, will become the new locomotive of the global economy and in time they will be the consumers of last resort. China’s voracious and insatiable appetite for raw materials will help shape and define its foreign policy and at times this could lead to various geo-political “flashpoints”. China has been particularly busy over the last five years securing its raw materials supply lines. Countries as diverse as Gabon, Sudan, Brazil, Iran and Australia have signed long-term contracts with China. Currently, 45% of China’s oil imports come from the Middle East and in October 2004 China signed an oil and natural gas agreement with Tehran that could be worth as much as US$70 billion over the next 25 years. China’s close relationship with Iran will be of particular interest to the neo-cons in the White House.
Back to the present. The revaluation of the Yuan last year was the first step in a very long term and measured process. Over the long term the Yuan will inevitably appreciate. Last year also saw a further liberalization of the financial sector.
Bank of China allowed foreign strategic investors and the Bank of Communications was listed on the stock market. The banking and financial system, however, remain the Achilles heel of the Chinese economy and the authorities will continue to manage the ‘change’ process in a very measured and typically Chinese fashion. Goldman Sachs recently published a report saying China would overtake the US by 2040. This study was produced before China increased its GDP by US$285 billion. To put this in context, the increase in the size of the economy was equivalent to the GDP of Austria or the combined annual output of Argentina, Venezuela and Ecuador.
INDIA
The Indian stock market, the Sensex, rose 42.33% in 2005. Over the past three years the Sensex has almost tripled, making it the second best performing index in the region. Pakistan, interestingly enough, being the best performer over this period. Net foreign purchases of stocks rose to a record US$10.7 billion last year and domestic investors turned net buyers, investing US$2.4 billion, having been net sellers in 2004. In many ways India is the mirror image of China. In contrast to China, India’s economy is dominated by services, which account for approximately 50% of the economy. Manufacturing is only 16%. There are many other differences too. India’s infrastructure is very third world in stark contrast to China. India is the world’s largest democracy and China is the world’s largest non-democratic country. This somewhat paradoxically explains the chronic lack of modern infrastructure. A major impediment to growth in India is the political system, red tape and excessive bureaucracy. Similarly, any serious economic reform is often blocked by the socialist and communist parties.
In recent years, however, there does appear to be some progress and the government, under the leadership of Prime Minister Manmohan Singh, has engineered a programme of cautious liberalization. The government has recently announced a number of initiatives to address the chronic problems relating to poor infrastructure. US$37 billion will be spent on roads over the next 7 years and a major programme to provide electricity and water to India’s rural areas has been announced. India has clearly embarked upon the path of rapid economic development and the potential is truly enormous. We should remember that nearly 40% or 400 million people in India still live on about US$1 per day. Economic progress over the last decade has been dramatic and in fact has accelerated over the past three to five years. A recent study suggests that India’s market for consumer goods may expand to US$400 billion by 2010 from US$250 billion in 2003, making it one of the five largest in the world.
There is increasing evidence of a significant increase in foreign direct investment by American and Japanese multinationals. Some Japanese companies see India as a “hedge” against their significant exposure to China. Recent evidence of tension between China and Japan has led some Japanese corporates to re-think their China strategy and India could be a beneficiary of this. About a year ago Prime Minister Singh declared, “Together we will change the world”. He was standing alongside Premier Wen of China. I have no doubt that he will be correct in his prediction. From an economics perspective the outlook is clear. India will go from strength to strength. There are many obstacles, infrastructure, the political system etc., however, ultimately India will take its place at the table of the economic giants. From a stock market perspective the outlook is more complex. The stunning rise in the Sensex index means it now trades on a forward P/E multiple of about 18 times, this compares with the forward P/E on the MSCI emerging markets at about 13 times. The Sensex P/E is now very close to a five year high. Earnings growth in 2006 is forecast to be approximately 16% after 25% per annum growth over the past four years. Some consolidation is likely after its breathtaking ascent. Longer term, I remain positive on India.
JAPAN
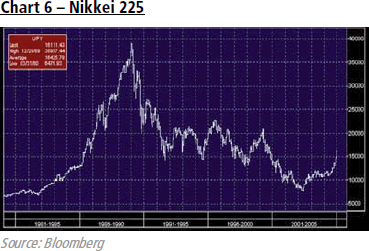
In September last year, Hiromichi Shirakawa, Chief Economist at UBS in Tokyo, was quoted in the Financial Times as saying, “When the economy turns up, higher household spending benefits first the Japanese wife, followed by the children and the family pets and finally the husband.” I have used this quote on many occasions. The recovery in the Japanese economy is no longer a forecast, it is a fact. The stock market celebrated the economic recovery by rising a stunning 43.50% for its biggest annual rise since 1986, and its best second half rally since US occupation forces left in 1952. Is there a message here for the Iraqi stock market? (see chart 6).
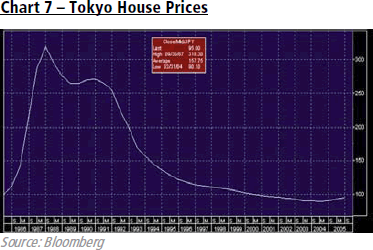
Real estate prices have stopped falling and in Tokyo, house prices are now rising serving to underwrite the economic recovery (see chart 7).
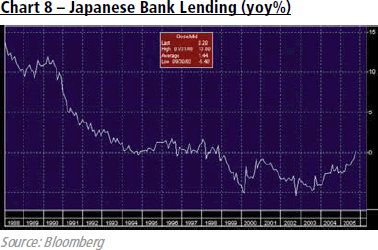
The banking system is clearly back from the brink and bank lending has just turned positive for the first time since 1998 (see chart 8).
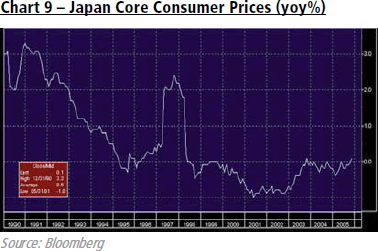
There is much speculation that the Bank of Japan will soon end its “quantitative easing” policy and similarly abandon it’s de facto zero interest policy. Core consumer prices (ex food) rose 0.1% in November, at an annual rate, only the second such increase in more than seven years (see chart 9).
Prime Minister Jurichiro Koizumi ’s landslide election victory on 11 September was the catalyst for the spectacular rally in the market from September to year end. For international investors, Koizumi’s historic win meant that the nation had finally embraced and accepted the need for continued reforms.
At the center of Koizumi’s reformist agenda was the proposed privatization of the Japanese Post Office, the world’s largest savings bank with 350 trillion Yen (US$3.1 trillion) in assets. To date, foreign investors have by far been the largest buyers of Japanese stocks with domestic investors remaining rather timid. It is only a matter of time before Japanese investors begin to believe in the stock market again and allocate a proportion of their vast savings to stocks. Even the smallest shift from savings deposits to stocks will lead to a massive influx of funds.
The Japanese consumer has emerged from a 15 year hibernation and has the financial firepower to spend. The improvement in business and consumer sentiment, combined with an undeniable recovery in real estate prices will serve to underwrite economic growth in 2006. The positive economic outlook has, however, been very much factored into stock prices.
I have been very bullish on the Japanese market through 2005 and I remain positive but I cannot bring myself to suggest we shall have another year like 2005.
Moving forward, greater economic activity will generate opportunity, however, the set and forget approach, which paid so well in 2005, may not be the appropriate strategy in 2006. I, therefore, anticipate a lot more volatility in Japan this year, particularly as we approach the abandonment of the Bank of Japan’s zero interest rate policy. Japan has finally emerged from a classic Keynesian “liquidity trap”. The second largest economy in the world has suffered nearly a decade of deflation and a consumer in hibernation. The banking system came perilously close to“systemic failure” as non-performing loans soared and real estate markets crashed. The stock market collapsed from nearly 39,000 in December 1989 to just 7,600 in May 2003 (see chart 6).
Looking ahead the privatization of the Japanese Post Office will be of enormous significance to the financial markets. At the present time Japan Post holds a quarter of the nation’s savings. Over time, and it will take many years, their investment portfolio will increase its exposure to equities versus bonds. The Japanese Post Office is the sleeping giant of the investment world and its privatization will, over the next five years, have significant implications for the world’s bond and equity markets, and on balance it will favour equities over bonds.
AUSTRALIA
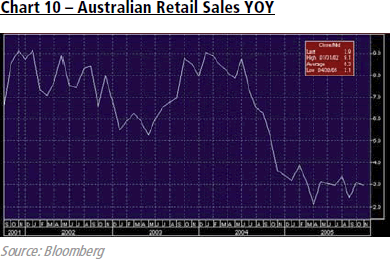
The Australian economy in 2005 could best be characterized as a China versus housing story. The weakness in housing and the commensurate slowdown in consumer spending (see chart 10) was partially offset by strength in business investment which in turn was driven by China in particular and Asia in general.
The Reserve Bank touched the monetary brake in March and raised rates by a ¼% to 5.5% and has since kept rates unchanged. I see no reason for the RBA to change rates in the foreseeable future. I continue to believe that the housing market will remain soft for many years to come, which will in turn serve to restrain consumer spending.
Despite the weakness, over the past two years, particularly in Sydney and Melbourne, recent housing affordability data suggests that house prices still remain well above their historic trends. Looking ahead, I believe economic growth will be between 2% to 3%, with business investment remaining strong and housing investment remaining weak. Whilst the economy has been somewhat subdued, the stock market has continued to make new highs (see chart 11).
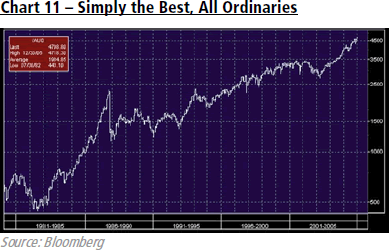
The resource sector has clearly been the pace-setter with BHP accounting for a significant portion of the overall markets rise. BHP is an Asia/China play, full stop. If you believe in Asia, you believe in BHP. Regarding valuations, there has been some discussion that Australian stocks are becoming somewhat expensive. The forward P/E is currently about 15 times and the current P/E is about 17 times. One could argue stocks are around fair value on an absolute basis and slightly cheap relative to bonds. Versus real estate they are certainly cheap.
So can the Australian market continue to perform? The fundamentals, looking at earnings, valuations, economic growth, inflation and monetary policy, suggest that the market could continue to generate returns of 10% -15% in the year ahead. In the big picture I remain very excited about Australia’s multi-decade outlook. Australia will continue to be a significant beneficiary of the Asian economic phenomenon. Tourism, resources, services (education, legal, accounting) will all benefit from our ever increasing integration into the Asian economic region.
OIL

I shall not spend a lot of time on oil, as you should know my views by now, higher. In the spirit of “a picture paints a thousand words”, please look at chart 12 which shows the correlation between Chinese oil imports and oil prices. There really isn’t much more to say. Take a photograph of your 4WD and put it in your family photograph album.
CONCLUSION
The center of economic gravity continues to shift from the West to the East. If you fear this inevitable process, consider the following question. Would you prefer a global economic engine with only one cylinder or one with six? We should be grateful for the economic role that America has played for more than 10 years. The nation of shop till you drop has been the sole locomotive of the global economy. Their propensity to consume, borrow and amass unprecedented debt has kept the world afloat and enabled China to emerge from a multi-century hibernation. The imbalances in the US are simply unsustainable. The housing market is set to fall, which in turn will weaken the economy. America has spent too much and saved too little. In contrast, Asia has spent too little and saved too much. Over the next decade, these trends will, through necessity, be reversed. More than 3 billion Asians have embarked upon the path of rapid economic development. Their savings are vast and as their incomes rise, which they shall, they will spend more.
Asia will become the consumer of last resort. In this fundamental regard, such an outcome will restore a much better balance to a very ‘unbalanced’ world. The path to a more balanced world will be marked by uncertainty and volatility, but ultimately the universe of potential investment opportunity has become much larger. A year ago, I spoke of the world being at the “Mother of all Crossroads”; in 2005 we made the crossing and now know the ultimate destination.
May I wish you and your families a very Happy New Year and I look forward to presenting to you over the course of the year.